

Japanese Data on Covid19 Jab Deaths and Injuries
A press conference was held on data obtained down to municipality level for Deaths, Injuries and most importantly Doses given, to allow more analysis of Lot Toxicity.

I have asked the researchers in Japan if they have obtained any Endotoxin measurements through their FOI activity. You might like to follow the thread.

Thanks to Aussie17 on X for directing us to the YouTube version.
Here is the Table of data that can be sorted by clicking the various columns.1
I have sorted by the case Mortality percentages on the right hand column.
The second last column is doses given.
Note the data is split into 3 Age Groups.

continuing

continuing

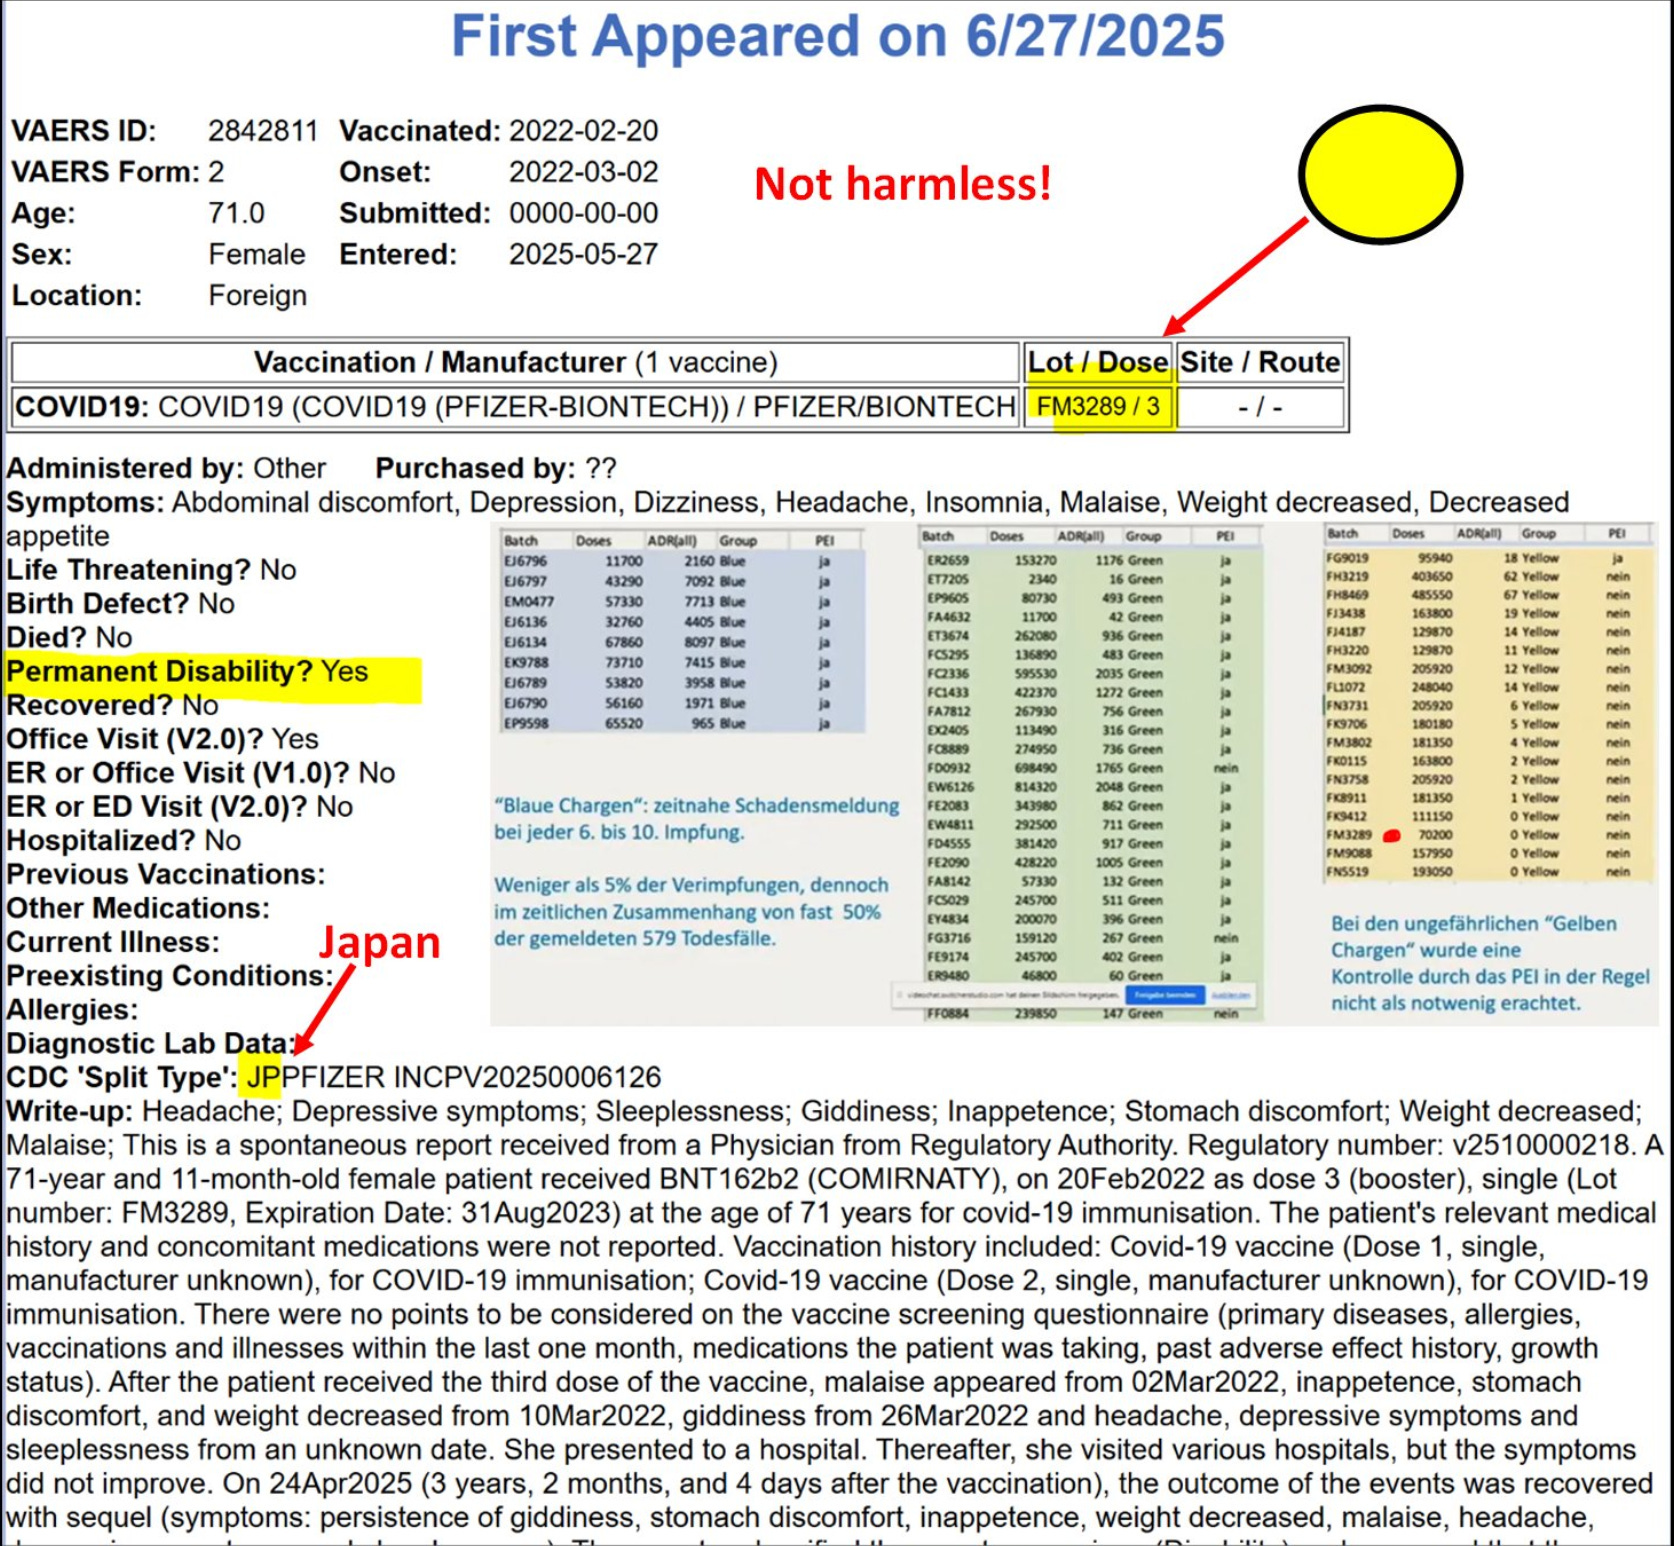
Yellow Dot Lots used in Japan
Note that not displayed in the list above, found when I visited the website, is Lot FM3289.
My friend Albert just provided2 this case for a 71-year-old lady in Japan who suffered when boosted with this “Yellow Dot” lot.
I checked the Japanese database3 for Lot FM3289 where we see 死亡数 = number of deaths is 3,066. This huge number needs to be checked.

Here is another “Yellow Dot” Lot with 11 Deaths in Japan. Lot FM9088.

Looks like all “Yellow Dot” and “Green Dot” Lots should be searched individually at the Japanese website.
Check out the list of lots when you sort by the Deaths Column.

continuing

continuing

continuing

Peak Deaths occur in Days after First Jab
Here is a slide from the presentation which clearly shows the peak of Deaths was faster, in a matter of days, after the First Jab. See the bottom curve of Diamonds.
So the description on the right needs to be corrected.

I have discussed early Jab Deaths in Japan.4
The database will be most useful when analyzed by Jab manufacturer over time, taking account of compostion changes.
See earlier discussions that I update when there is something new.567
Please let me know your thoughts here, or on X, or Gettr.
https://stop-mrna.sakura.ne.jp/db/lot_totalization.php

https://stop-mrna.sakura.ne.jp/db/lot_details.php?lot_name=FM3289
Relative Lethality of COVID-19 vaccines - who is measuring the casualties?

Japan Relative Lethality data for the Covid19 Jabs
Yellow Dot Hot Lots Update from Albert

If you have not heard of Pfizer Yellow Dot Hot Lots before, please check out my 2-year-old post on the fallacious interpretation of VAERS data that did not take account of the number of Jabs actually given from various Covid19 Jabs or the timeline of data release.
Pfizer Jab Lot FW5101 Killed Children in Japan. TGA removed it from its Batch Release website?

FW5101 is a Covid19 lot of special interest because it was one of many jabbed into the arms of Children with no Clinical Trial after Pfizer changed buffer from Phosphate to Tromethamine.

I just watched the whole Japanese Press Conference again and they state that the data they obtained does not include Cause of Death. They are working on a translation of the website into English. Translator Izumi Kamijo did a great job.
Finally I get it. (Thanks for your patience explaining this Geoff). First column where there are 3 columns per age group, is number of deaths in that lot of that age group, 2nd column= number of doses of that lot given to that age group ,3rd column percentage of deaths per doses given in that age group of that lot . Three columns per age group.
At the end are 3 columns for total deaths per lot then total doses given per lot then total percent of death per doses given of that lot.
So going back to the lot at the head of the table
Lot FM8584
In the 0 to 19 age group.
0 deaths
0 doses given
percent of deaths per dose 0 percent
In the 20 to 69 age group
0 deaths
6 doses
percentage of deaths per dose 0 percent.
In 70 and above age group
5 deaths
6 doses
percentage of deaths per dose 83.33 percent.
Across all age groups
5 deaths
12 doses given
percentage of deaths per dose 41.667
That's plenty scary.