eldric.substack.com
This CotD was inspired by two recent articles:
1) The Korea Herald “SK Bioscience to supply Novavax’s new COVID-19 vaccine in Korea” (see link: https://www.koreaherald.com/view.php?ud=20231129000810). From the article: “SK Bioscience's announcement was made after the Ministry of Food and Drug Safety of South Korea gave emergency use authorization for the Novavax COVID-19 vaccine earlier in the day.” and “Novavax’s updated COVID-19 vaccine is the only COVID-19 vaccine based on a recombinant protein-based platform in the government’s recent vaccine program. This platform, which has been widely used in the development of many other vaccines, including influenza, hepatitis B and HPV, will add a safe administration option to the state-led vaccine program,” an official from SK Bioscience said.
2) Reuters “COVID-19 Shrinks Life Expectancy in S.Korea for First Time Since 1970” (see link: https://www.usnews.com/news/world/articles/2023-12-01/covid-19-shrinks-life-expectancy-in-s-korea-for-first-time-since-1970). From the article: “South Korea managed to rein in COVID-19 deaths at the start of the pandemic before a sharp uptick in 2022, when the statistics agency recorded more than 370,000 deaths from the coronavirus.”
The author of the CotD has combined analyses of Covid-19 and Excess Deaths (all causes) as these are related.
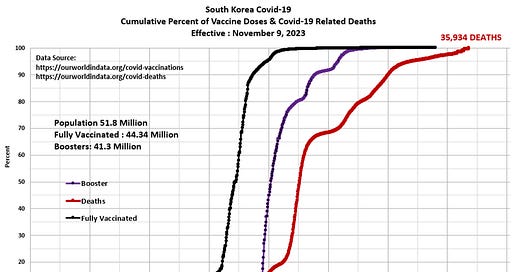
Panel 1 The first graph is a construct by the author as a standard CotD presentation which illustrates Covid-19 related deaths (CRDs) and vaccinations. South Korea Covid-19 Related Death (CRD) rate was relatively low from March 2020 to August 2021. The vaccination program started in late February 2021 with minimal impact on the somewhat flattened CRD rate. Observe the uncharacteristic rise of CRDs almost immediately after the booster program was initiated in September 2021 followed by a meteoric rise of CRDs in February 2022 about 4 to 6 months later. The vaccine-to-deaths correlation of near 100 percent is clearly evident. The CRD rate peaked at 470 South Korean citizens dying in one day in March 2022, which was unconscionable and absolutely tragic to say the least. The author could not find an official statement by the South Korea Ministry of Health and Welfare indicating “the vaccines are safe and effective”.
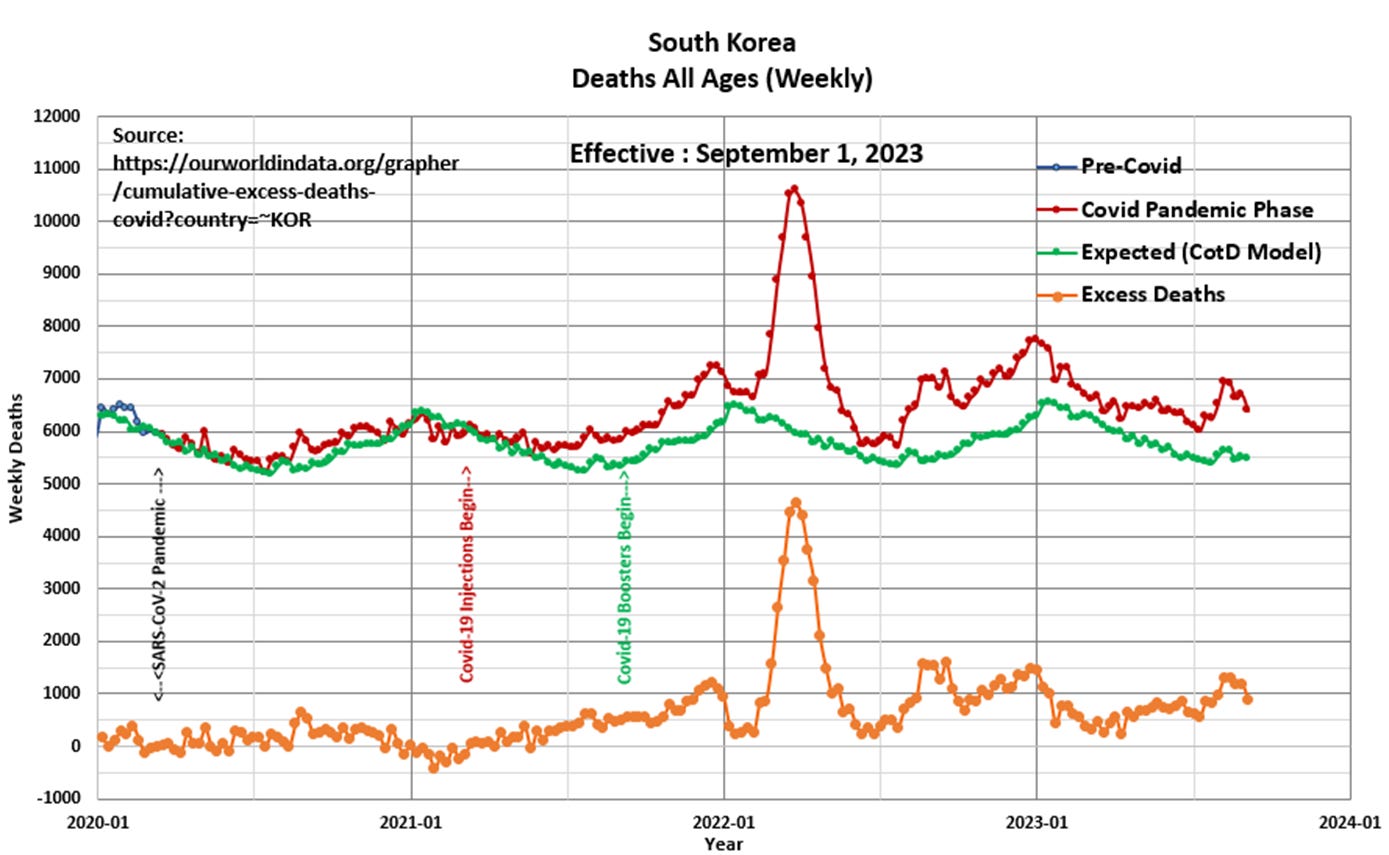
Panel 2 Observe the characteristic cyclical nature of deaths or all-cause mortality since 2015. The “Blue” line represents data prior to March 2020 and the “Red” line represents data since the SARS CoV-2 pandemic was initiated in March 2020. The “Green” line represents the “Expected” deaths (CotD Model) based on historical averages. The author has utilized the data for the five year period January 2015 to December 2019 in order to calculate an average normalized curve for Weekly Deaths. The Expected (CotD Model) deaths incorporates an average 4 percent growth factor which may sound aggressive, however, this approach appears to be a good match to the overall trend.
Panel 3 This presents the magnified portion (January 2020 to September 2023) of the graph in Panel 2. The “Orange” line represents “Excess Deaths” which is calculated by subtracting Expected Deaths from Official Deaths.
Panel 4 Based on the data and this author’s model, there have been 120,766 Excess Deaths since the start of Covid-19 injections in February 2021. This compares to 82,538 excess deaths over the same time frame as per the https://ourworldindata.org/grapher/cumulative-excess-deaths-covid?country=~KOR website. The vast majority of Excess Deaths (95 percent) have occurred since initiation of the vaccine injection program.
“Your future depends on what you do in the present” Korean Proverb


